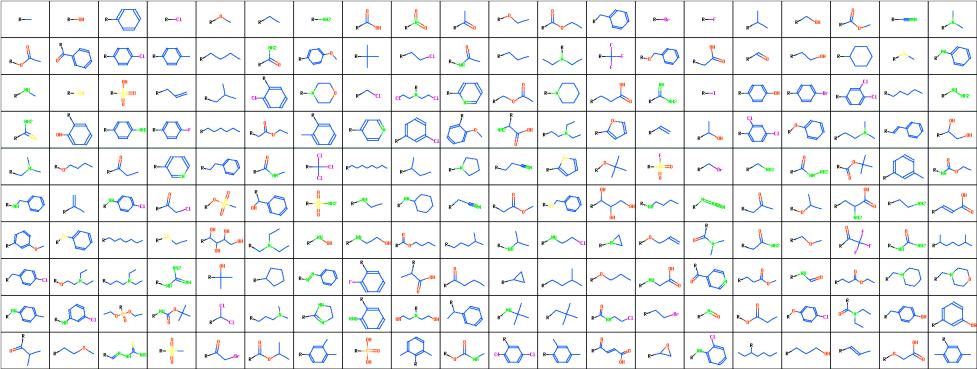
200 Substituents Used in the Study
Uwe Eichlera, Peter Ertla, Alberto Gobbia and Bernd Rohdeb
aNovartis Crop Protection AG and bNovartis Pharma AG, CH-4002 Basel, Switzerland
Keywords: organic substituents, substituent properties, diversity selection, selection of an optimal subset, selection algorithms
Publication date: April 28 1999 22:09:00 GMT
200 Substituents Used in the Study
Properties of substituents were characterized by their hydrophobicity, electron-accepting power and by their size. Hydrophobic properties were represented by the octanol-water partition coefficient (logP) and molar refractivity. These parameters were calculated according to the methodology of Ghose and Crippen 15 based on the sum of atomic hydrophobicity contributions. The electron-donating and -withdrawing power of substituents was characterized by theoretical parameters compatible with the Hammett sigma constants. These are calculated from simple quantum chemical data according to the methodology developed in-house 16 . Both methodologies have been tested on a set of more than 300 common organic substituents and the agreement with experimental substituent parameters was very good 17 . Steric properties of substituents were represented simply by their topological size (number of nonhydrogen atoms) and maximal topological length. All parameters were scaled to have zero mean and unit standard deviation. Principal component analysis was applied to reduce the dimensionality of the problem to enable simple visual examination of physicochemical space covered by the substituents. The first two principal components capture 86% of the information contained in the whole dataset. The first component (x-axis on the images below) represents hydrophobicity and size, and the second component (y-axis) represents electron-donating and -withdrawing properties of substituents.
 The simplest selection method is the random selection. The only
computational requirement of this approach is necessity to check that the particular
molecules are not selected more than once. Although results based of the random
selection often look quite reasonable and there are articles reporting better results for
random selection than for sophisticated selection techniques, the authors think that we
have better possibilities than to be at the mercy of a random number generator.
The simplest selection method is the random selection. The only
computational requirement of this approach is necessity to check that the particular
molecules are not selected more than once. Although results based of the random
selection often look quite reasonable and there are articles reporting better results for
random selection than for sophisticated selection techniques, the authors think that we
have better possibilities than to be at the mercy of a random number generator.
 The dissimilarity selection is one of the most commonly used methods for the
diversity-based selection of molecules
18
.
The algorithm is fast and is internally consistent, i.e. smaller selection is always subset of a larger one.
The selection process is organized in such a way that the next compound to be selected is always
as distant as possible from
already selected molecules. In principle, the algorithm takes always the compound which is in
the largest unselected void of the compound set. In high dimensional spaces the
algorithm prefers the selection of outliers (compounds at the edge of the property space).
The dissimilarity selection is one of the most commonly used methods for the
diversity-based selection of molecules
18
.
The algorithm is fast and is internally consistent, i.e. smaller selection is always subset of a larger one.
The selection process is organized in such a way that the next compound to be selected is always
as distant as possible from
already selected molecules. In principle, the algorithm takes always the compound which is in
the largest unselected void of the compound set. In high dimensional spaces the
algorithm prefers the selection of outliers (compounds at the edge of the property space).
 The sphere exclusion algorithm implemented here is based on the work of
Hudson et al.
19
and Wooton et al.
20
. First the radius of an exclusion sphere is
defined. The selection starts with the molecule having the largest sum of distances
from all other molecules. Then all molecules that are closer to the selected
molecule(s) then the exclusion radius are deleted from the list. A new molecule is
selected which is most distant from any already selected molecule. The whole process
is repeated until no more molecules remain. The selection starts in the edge regions of
property space and then moves to the center. The number of selected molecules
depends on the exclusion radius, so when a predefined number of points is needed the
whole procedure must be iteratively repeated with changing exclusion radius. (In the
applet we have predefined the exclusion radius to provide 10, 20, 40 and 80 molecules to
enable comparison with other methods).
The sphere exclusion algorithm implemented here is based on the work of
Hudson et al.
19
and Wooton et al.
20
. First the radius of an exclusion sphere is
defined. The selection starts with the molecule having the largest sum of distances
from all other molecules. Then all molecules that are closer to the selected
molecule(s) then the exclusion radius are deleted from the list. A new molecule is
selected which is most distant from any already selected molecule. The whole process
is repeated until no more molecules remain. The selection starts in the edge regions of
property space and then moves to the center. The number of selected molecules
depends on the exclusion radius, so when a predefined number of points is needed the
whole procedure must be iteratively repeated with changing exclusion radius. (In the
applet we have predefined the exclusion radius to provide 10, 20, 40 and 80 molecules to
enable comparison with other methods).
 The aim of this algorithm is to select a subset of compounds which most
effectively represents the compounds in the original population
19
. The information value
of a compound is evaluated as a sum of reciprocal values of ranks of distances to other compounds.
This is calculated in a following way: The Euclidean distances from the molecule 1 to all other molecules are calculated, distances are ranked and the reciprocal values of rank are added to the information value of each molecule (e.g. 1/2 for the closest neighbor, 1/3 for the second closest etc.).
After processing all molecules the compound with the largest sum (most
descriptive compound) is selected. The whole procedure is repeated until the required
number of compounds has been selected. This approach assures that the more dense
regions of property space are well represented.
The aim of this algorithm is to select a subset of compounds which most
effectively represents the compounds in the original population
19
. The information value
of a compound is evaluated as a sum of reciprocal values of ranks of distances to other compounds.
This is calculated in a following way: The Euclidean distances from the molecule 1 to all other molecules are calculated, distances are ranked and the reciprocal values of rank are added to the information value of each molecule (e.g. 1/2 for the closest neighbor, 1/3 for the second closest etc.).
After processing all molecules the compound with the largest sum (most
descriptive compound) is selected. The whole procedure is repeated until the required
number of compounds has been selected. This approach assures that the more dense
regions of property space are well represented.
 The partition technique
21
is based on the partition of the property space into a set
of multi-dimensional cells, by dividing each axis into several
bins. A representative compound is then selected from each occupied cell. This is
done mostly according to the distance from the center of the cell, but also another
criteria (i.e. cost, or synthetic feasibility) are possible. Partition selection method is
intuitive, very fast and easy to implement, but due to the explosive increase of the
number of cells applicable only for low-dimensional representations of the property
space. Another disadvantage of the method is the fact, that the number of
molecules to be selected can not be set in advance. It depends not only on the number of
bins, but also on the distribution of points in space (edge cells are usually empty).
The partition technique
21
is based on the partition of the property space into a set
of multi-dimensional cells, by dividing each axis into several
bins. A representative compound is then selected from each occupied cell. This is
done mostly according to the distance from the center of the cell, but also another
criteria (i.e. cost, or synthetic feasibility) are possible. Partition selection method is
intuitive, very fast and easy to implement, but due to the explosive increase of the
number of cells applicable only for low-dimensional representations of the property
space. Another disadvantage of the method is the fact, that the number of
molecules to be selected can not be set in advance. It depends not only on the number of
bins, but also on the distribution of points in space (edge cells are usually empty).
 The similarity stress method developed in-house defines a pairwise stress function that increases sharply with increasing similarity of two molecules.
The objective of the method is to select a subset of molecules in such a way that the total stress function becomes minimal.
The method starts by selecting a random subset of molecules.
Then it cycles through the set by adding a candidate, computing the stress increment incurred by each molecule and removing the worst of the set, i.e. the one with the largest stress increment.
This process is continued until a full cycle through the set of nonselected molecules does not yield any improvement.
In practice, five to ten optimization cycles are sufficient.
Two features of the method are worth noting: Firstly, because the stress function is a sum of pairwise components, the procedure can be implemented by incrementally updating and removing stress increments as a new molecule is added or removed, which greatly reduces the number of operations required.
Secondly, the stress functions can contain also a factor that increases with the molecular complexity, its cost, or some other measure of its value.
This would drive the selection towards lead compounds that are cheaper and easy to synthesize.
The similarity stress method developed in-house defines a pairwise stress function that increases sharply with increasing similarity of two molecules.
The objective of the method is to select a subset of molecules in such a way that the total stress function becomes minimal.
The method starts by selecting a random subset of molecules.
Then it cycles through the set by adding a candidate, computing the stress increment incurred by each molecule and removing the worst of the set, i.e. the one with the largest stress increment.
This process is continued until a full cycle through the set of nonselected molecules does not yield any improvement.
In practice, five to ten optimization cycles are sufficient.
Two features of the method are worth noting: Firstly, because the stress function is a sum of pairwise components, the procedure can be implemented by incrementally updating and removing stress increments as a new molecule is added or removed, which greatly reduces the number of operations required.
Secondly, the stress functions can contain also a factor that increases with the molecular complexity, its cost, or some other measure of its value.
This would drive the selection towards lead compounds that are cheaper and easy to synthesize.
 Statistical designs like the D-optimal design have been developed to select an
optimal set of points for model building. The D-optimal design
22
selects points so
that the potential errors in descriptors have minimal impact on an assumed (usually linear)
model. Possible model errors are not accounted for.
Therefore, the selected points will always be on the outer surface of the space
occupied by the candidates. A close distance of the any two points does not decrease
the D-optimal quality of the design. In the case of chemistry, however, a linear model
is often not appropriate and D-optimal design is not the best choice
23
Statistical designs like the D-optimal design have been developed to select an
optimal set of points for model building. The D-optimal design
22
selects points so
that the potential errors in descriptors have minimal impact on an assumed (usually linear)
model. Possible model errors are not accounted for.
Therefore, the selected points will always be on the outer surface of the space
occupied by the candidates. A close distance of the any two points does not decrease
the D-optimal quality of the design. In the case of chemistry, however, a linear model
is often not appropriate and D-optimal design is not the best choice
23
 The local D-optimal design was developed in-house to overcome the above
problems of D-optimal design. In the LD-optimal design, each selected point is evaluated
by the D-optimal design criterion relative to its m nearest neighbors where m is equal
to the dimensionality of the descriptor space plus one. The sum of these D-optimal
design scores is used as the quality criterion for the LD-optimal design.
The algorithm therefore
selects points which are far apart from each other and represent space better than points selected by the D-optimal design.
The local D-optimal design was developed in-house to overcome the above
problems of D-optimal design. In the LD-optimal design, each selected point is evaluated
by the D-optimal design criterion relative to its m nearest neighbors where m is equal
to the dimensionality of the descriptor space plus one. The sum of these D-optimal
design scores is used as the quality criterion for the LD-optimal design.
The algorithm therefore
selects points which are far apart from each other and represent space better than points selected by the D-optimal design.
1. Pleiss, M; Comprehensive Medicinal Chemistry 1990, 561
2. Agrafiotis, D; Encyclopedia of Computational Chemistry 1998
3. Craig, P; Journal of Medicinal Chemistry 1971, 14, 680
4. Topliss, J; Journal of Medicinal Chemistry 1972, 15, 1006
5. Hansch, C; Journal of Medicinal Chemistry 1973, 16, 1217
6. Hansch, C; Exploring QSAR, Fundamentals and Applications in Chemistry and Biology 1995
7. Hansch, C; Exploring QSAR, Hydrophobic, Electronic and Steric Constants 1995
8. Plummer, E; Reviews in Computational Chemistry 1990, 119
9. Van Der Waterbeemd, H; Journal of Computer-Aided Molecular Design 1989, 3, 111
10. Domine, D; Journal of Medicinal Chemistry 1994, 37, 973
11. Domine, D; Journal of Medicinal Chemistry 1994, 37, 981
12. Devillers, J; Computer-Assisted Lead Finding and Optimization 1997, 109
13. Domine, D; Quantitative Structure-Activity Relationships 1996, 15, 395
14. Anon; http://dtp.nci.nih.gov/docs/dtp_data.html
15. Viswanadhan, V; Journal of Chemical Information and Computer Sciences 1989, 29, 163
16. Ertl, P; Quantitative Structure-Activity Relationships 1997, 16, 377
17. Ertl, P; Proceedings of the 13th Conference on QSAR, to be published 1999
18. Lajiness, M; Perspectives in Drug Discovery and Design 1997, 7(8), 65
19. Hudson, B; Quantitative Structure-Activity Relationships 1996, 15, 285
20. Wooton, R; Journal of Medicinal Chemistry 1975, 18, 607
21. Mason, J; Perspectives in Drug Discovery and Design 1997, 7(8), 85
22. Mitchell, T; Technometrics 1974, 16(203), 211
23. Higgs, R; Journal of Chemical Information and Computer Sciences 1997, 37, 861